
Figure 3.
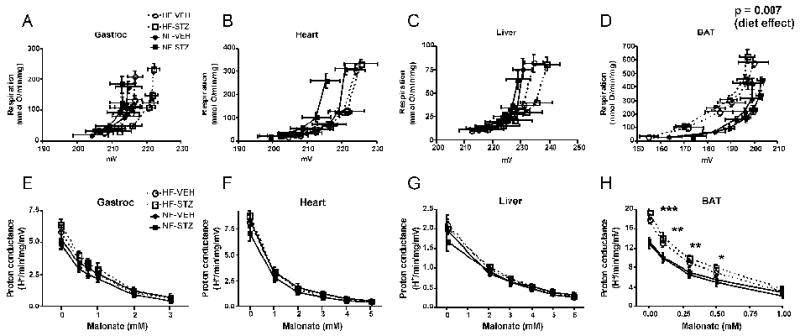
Assessment of the mitochondrial proton leak. Panels A-D: Kinetics of the proton leak in mitochondria isolated from gastrocnemius muscle, heart, liver, or brown adipose tissue (BAT) according to diet and glycemic status. Data points represent mean ± SEM for both respiration (proportional to hydrogen transfer) and membrane potential. Data were analyzed by comparing the proton conductance at the midpoint for individual curves. Analysis was carried out by 2-factor ANOVA (diet and glycemic status). Glycemic state had no significant effect for mitochondria of any tissue and there were no significant differences by diet for gastrocnemius, heart, or liver mitochondria. Panels E-H: Proton conductance of mitochondria isolated from the indicated tissues plotted as a function of the malonate concentration used to titrate potential (generating curves A-D, respectively). *** p < 0.001, ** p < 0.01, * p < 0.05 by 2-factor ANOVA for HF compared to NF at each malonate concentration. There was no effect of glycemic state and no interaction. n = 8-11 rats per group. HF-VEH = high-fat, vehicle-treated; HF-STZ = high-fat, STZ-treated; NF-VEH = normal-fat, vehicle-treated; NF-STZ= normal-fat, STZ-treated.