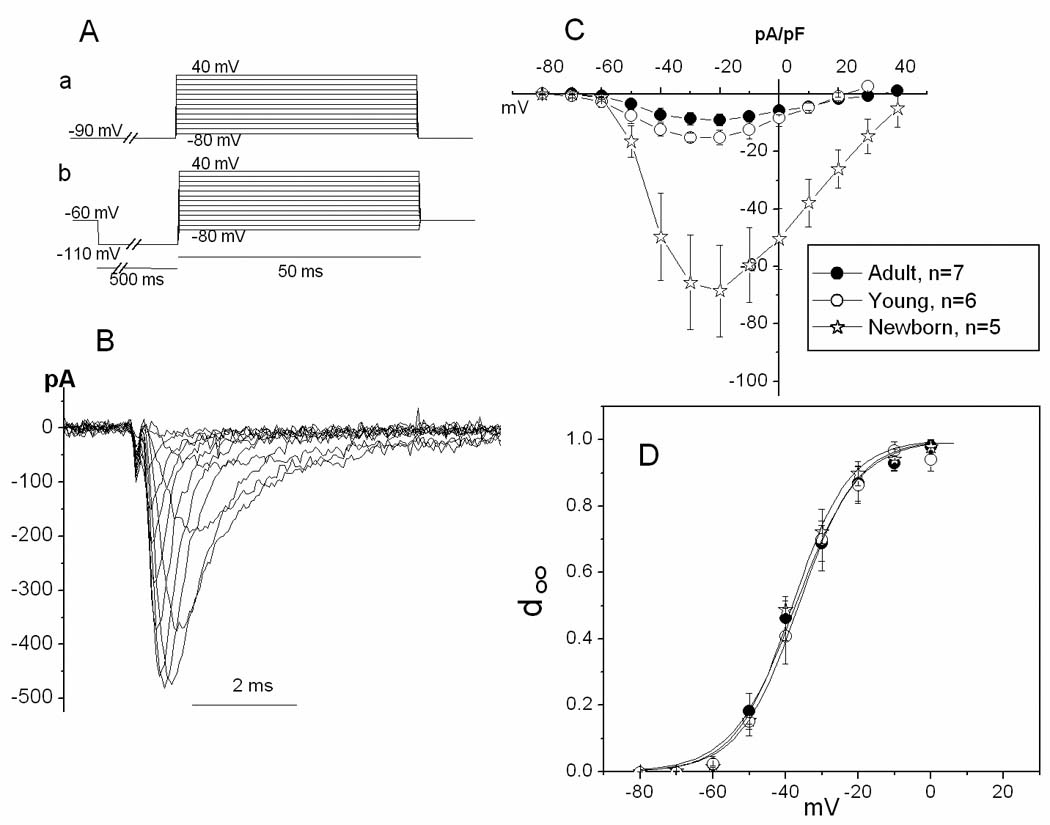
Figure 2. Age-dependence of INa I–V and activation relations.

A. Waveform configuration (see Methods) for recording INa. a and b: protocols used in experiments with newborn (a) or adult and young (b) animals (see Methods). B. Family of traces of INa recorded from an SAN cell from a 40 day old dog (young group). C. Mean I–V curves for three ages. D. Activation curves for three ages. Activation variable (d∞) was calculated as g/gmax. To determine g values, reversal potential for INa was estimated as the potential at which the extrapolation of the right limb of the I–V curve crossed the voltage axis; n values are the same as in C.
