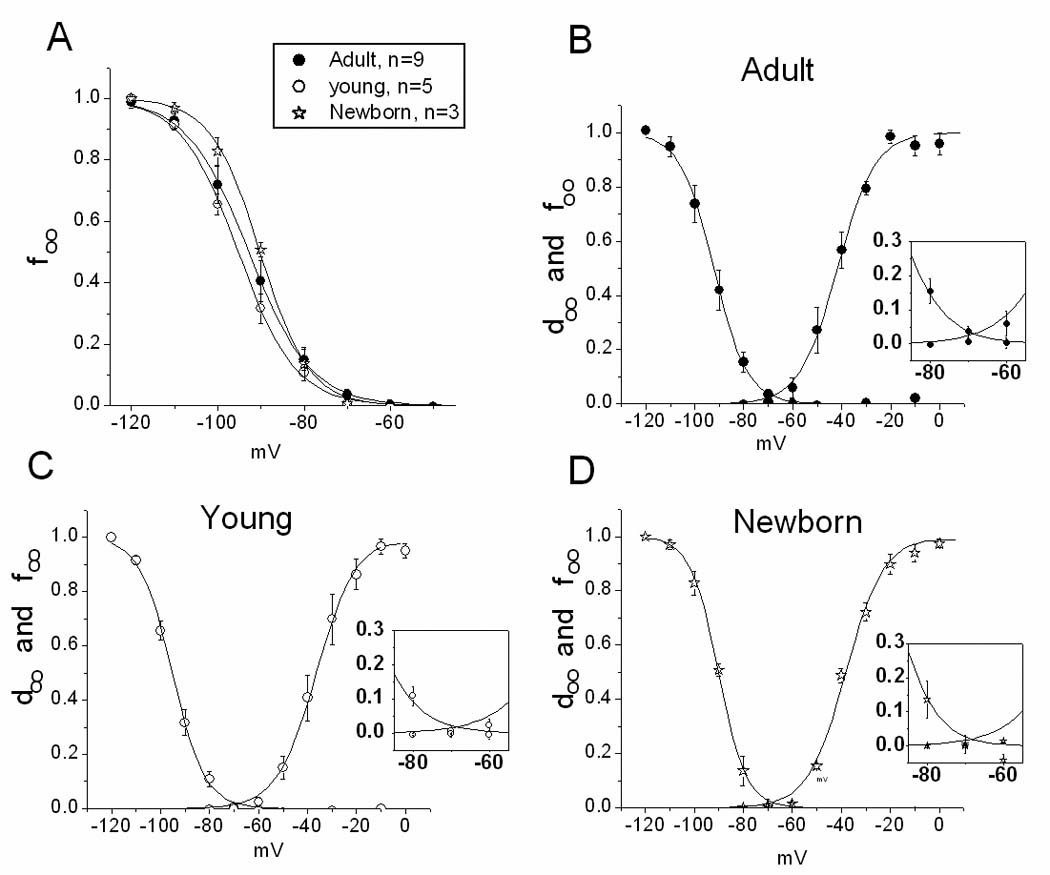
Figure 3. INa activation and inactivation relations.

A. Inactivation variable (f∞) for three age groups. B, C and D. Activation (d∞) and inactivation variables plotted together. Insets: Expansion of the middle portion of curves to illustrate the minimal ‘window” current for all groups. For n in activation curves, see Figure 2.
