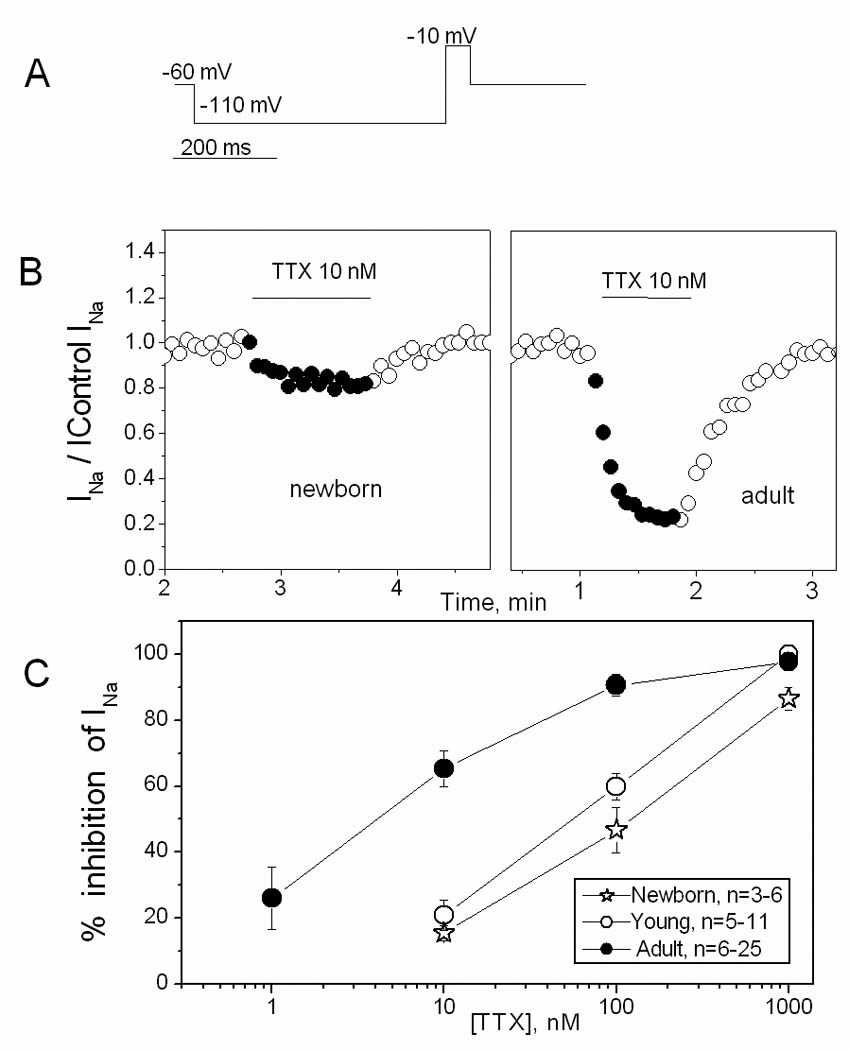
Figure 4. TTX sensitivity of INa.

A. Single step voltage protocol used to elicit INa. B. Time course of the effect of 10 nmol/L TTX on INa in newborn (left panel) and adult (right panel) SAN cells, illustrating the more pronounced effect in the adult. Values of the current are normalized to the control values. C. TTX concentration-effect curves for 3 ages.
