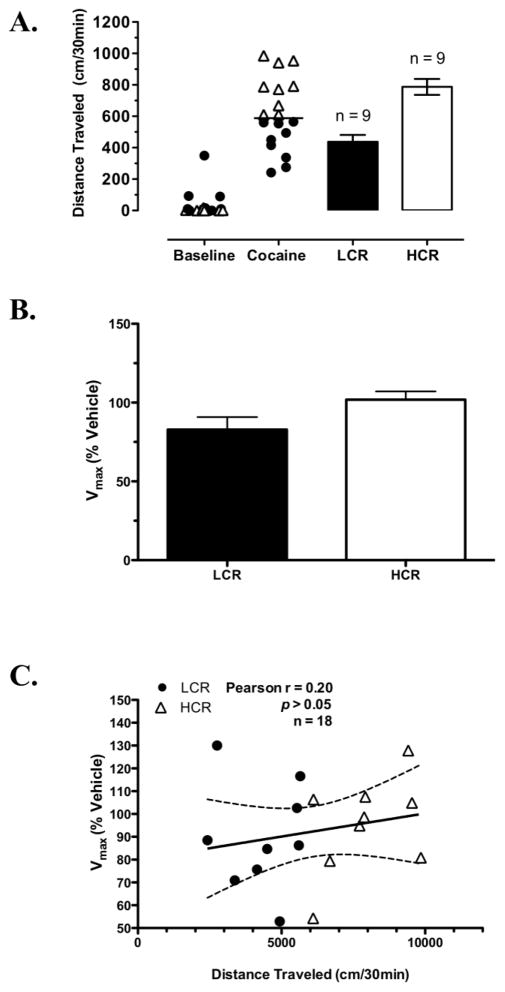
Fig. 4.
Classification of LCRs and HCRs and kinetic analysis of DAT-mediated uptake in striatal synaptosomes prepared 40 min post-cocaine from these rats. A Distribution of baseline and the initial 30 min of cocaine-induced locomotor activity in rats subsequently classified as either LCRs or HCRs (bars). The solid horizontal line represents this group’s median cocaine-induced locomotor activity. B [3H]DA uptake Vmax values for all LCRs (n = 9) and HCRs (n = 9) presented as a percentage of their respective veh-treated control; p = 0.06 for LCR vs. HCR. C Correlation of distance traveled 30 min post-cocaine and Vmax values at 40 min post-cocaine for all cocaine-treated rats. Bars in (A) and (B) are means ± SEM.

