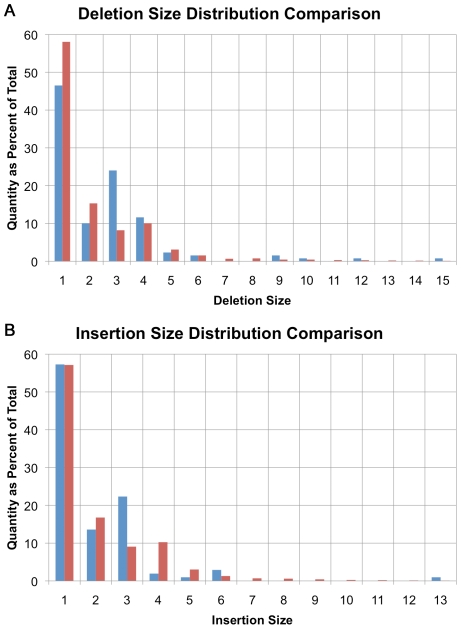
Figure 2. Small insertion/deletion size distribution.
(A) Distribution of small deletion sizes as a percent of total, comparing amino-acid encoding deletions (blue) with non-coding deletions (red). (B) Distribution of small insertion sizes as a percent of total, comparing amino-acid encoding insertions (blue) with non-coding insertions (red).

