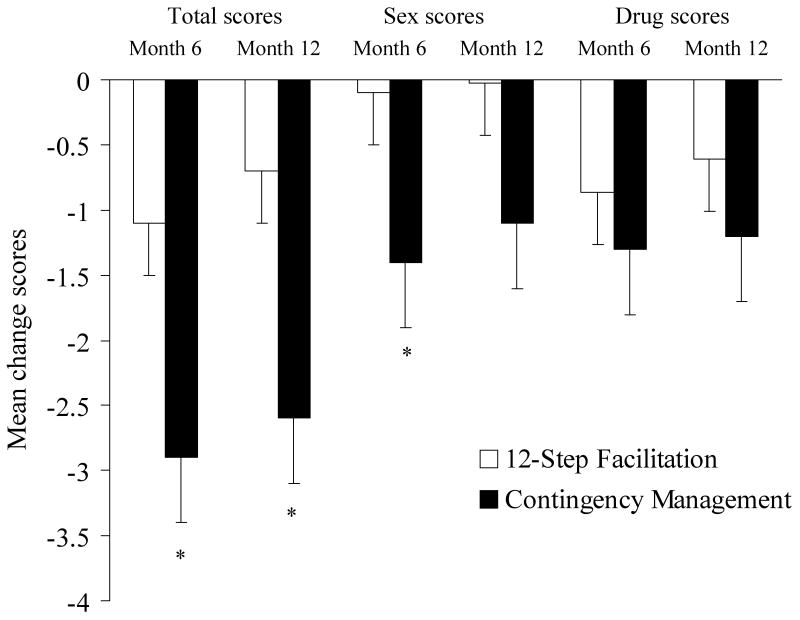
Figure 4.
Changes in HIV-Risk Behavior Scale scores between baseline and month 6 and between baseline and month 12. Changes are shown for total scores, as well as for the sexual and drug risk behavioral sub-scores. Participants assigned to the 12-step facilitation condition are shown in empty bars, and those assigned to contingency management are shown in filled bars. The asterisks indicate statistically significant differences between conditions based on univariate analysis of variance (p<.05).

