Figure 4.
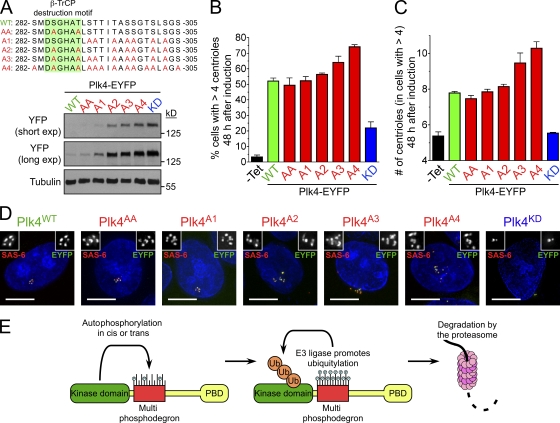
Phosphorylation of multiple sites is required for optimal Plk4 destruction. (A) Alignment showing the positions of the different phosphorylation mutations in Plk4. Immunoblot showing the relative expression levels of WT, AA, A1, A2, A3, A4, and KD Plk4-EYFP. (B) Graph quantifying of the proportion of cells with more than four centrioles 48 h after induction of Plk4-EYFP. Uninduced samples (−Tet) are shown for comparison. (C) Graph quantifying the mean number of centrioles per cell in cells with more than four centrioles. Counting was performed 48 h after induction of Plk4-EYFP. Uninduced samples are shown for comparison. (D) Immunofluorescence images acquired 48 h after Plk4-EYFP was induced. Insets depict an enlargement of centrioles. Red, SAS-6; green, Plk4-EYFP; blue, DNA. Bars, 10 µm. (E) A model for the autoregulation of Plk4 stability. Bars represent the mean of at least three independent experiments with >300 cells per condition. Error bars represent the SEM.

