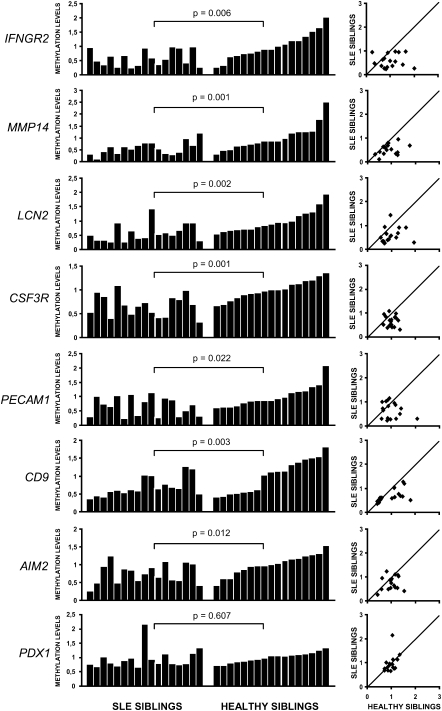
Figure 2.
A comparison of the DNA methylation levels of eight genes in paired samples discordant for SLE. Bisulfite pyrosequencing analysis was performed on the genes selected from experiments with methylation arrays. Methylation levels were normalized by dividing the percentage of methylation for each particular gene by the average percentage of methylation in the entire population (17 SLE discordant sibling pairs: six MZ twins, four DZ twins, and seven disease-discordant sibling pairs). Control samples are ordered right to left by decreasing level of methylation. SLE samples are on the left side of each graph, and the same order is maintained for their respective healthy twins or siblings. Each bar graph is accompanied by a scatterplot representing the normalized DNA methylation level of each gene for the control samples relative to their equivalent SLE sample.

