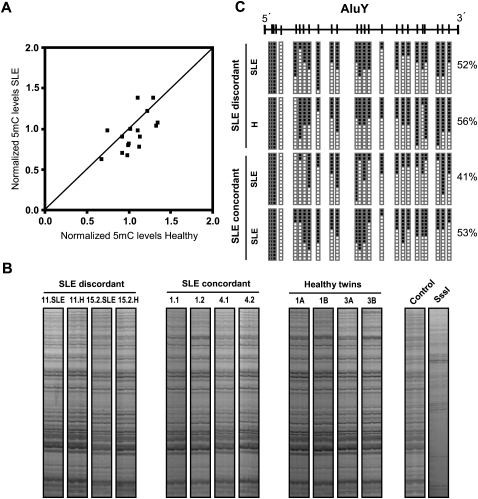
Figure 3.
(A) Scatterplot comparing total 5mC content in SLE siblings and their matching healthy siblings. Data are normalized with respect to the average 5mC methylation content in the entire population. (B) Band patterning corresponding to the analysis of unmethylated/methylated Alu repeats. Two SLE discordant MZ twin pairs, two SLE concordant MZ twin pairs, and two concordant pairs of healthy MZ twins are shown. To show the sensitivity toward DNA methylation changes, a WBC sample is compared with the same sample following limited treatment with SssI DNA methyltransferase. (C) Individual bisulfite sequencing of consensus Alu repeat. Fifteen clones are shown. (Black squares) Methylated CpG sites; (white squares) non-methylated CpG sites. One pair of SLE discordant MZ twins and one pair of SLE concordant MZ twins are shown.

