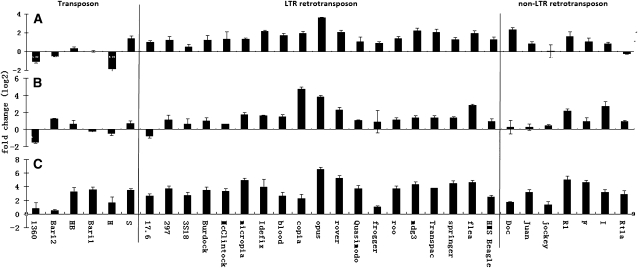
Figure 1.
Fold changes of TE mRNAs in piRNA pathway mutants relative to the wild type. The x-axis provides the names of the 32 TE families tested, and the y-axis is the log2 value of the fold changes. (A) piwi06843/CyO; (B) aubQC42/CyO; (C) aubHN/CyO. In each panel, the horizontal line at 0 represents the case when the expression level is the same in the mutants and wild-type flies. Three replicates were performed, and the average values ± standard errors are presented.

