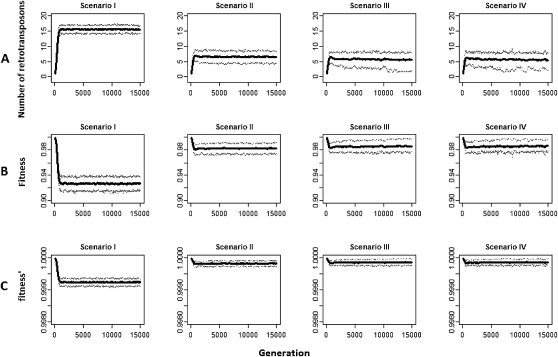
Figure 2.
The number of retrotransposons carried by one chromosome and the fitness costs to the host. (A) The number of retrotransposons carried by one chromosome. (B) The fitness of the host using the scaled a and b values in the simulations. (C) The fitness of the host using the unscaled a and b values. In scenario I, piRNAs have no repression effect on the activities of their targets. In scenarios II, III, and IV, piRNAs reduce a retrotransposon's retrotransposition rates to 10%, 1%, and 0.1% of its original rate, respectively. The solid line in each panel is the mean value, and the thin dashed lines represent the upper and lower 90% confidence bounds (Ne = 1000, a = 0.001, b = 0.0005, r = 2.5 × 10⁻⁸, u1 = 0.01, v = 0, after scaling for all the four scenarios, where Ne is the effective number of individuals, a and b are constants in the quadratic fitness function, u1 is the retrotransposition rate for each retrotransposon outside piRNA regions in the cells where piRNA is not expressed, v is the excision rate, and r is the recombination rate per nucleotide per generation; u2 is the retrotransposition rate for each retrotransposon outside piRNA regions in the cells where piRNA is expressed, u2 = 0.01, 0.001, 0.0001, and 0.00001, after scaling for scenarios I, II, III, and IV, respectively). In C, a = 10−5 and b = 5 × 10⁻⁶ were used in the quadratic fitness function.

