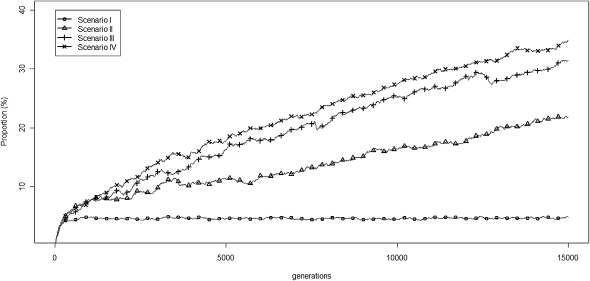
Figure 3.
The dynamics over time (generations) of the mean proportion (%) of all retrotransposons that are piRTs (Ne = 500, a = 0.001, b = 0.0005, r = 2.5 × 10⁻⁸, u1 = 0.01, v = 0, after scaling for all four scenarios; u2 = 0.01, 0.001, 0.0001, and 0.00001, after scaling for scenarios I–IV, respectively).

