Figure 6.
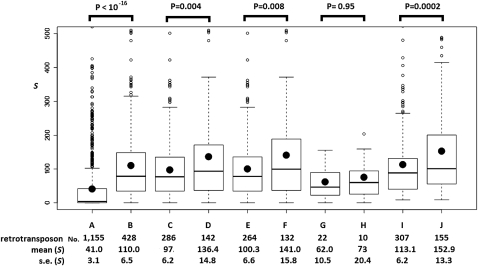
The boxplots of S scores for targetRTs (retrotransposons that are outside piRNA loci). (A) Nonautonomous/inactive retrotransposons. (B–H) Putatively autonomous targetRTs: (B) total putatively autonomous targetRTs; (C) rare autonomous targetRT insertions (the insertions only exist in the reference genome); (D) common autonomous targetRT insertions (the insertions exist in the reference genome and in at least one strain surveyed in this study or Gonzalez et al. 2008); (E) rare autonomous targetRT insertions in regions where recombination occurs; (F) common autonomous targetRT insertions in regions where recombination occurs; (G) rare autonomous targetRT insertions in nonrecombining regions; (H) common autonomous targetRT insertions in nonrecombining regions. The S scores of A–H are based on the small RNAs from the four piRNA libraries that are located inside the piRNA loci and perfectly antisense to TEs annotated in FlyBase R5.13 (see text). (I,J) S scores for all the putatively autonomous retrotransposons (inside and outside piRNA loci) with all the small RNAs in the four libraries (they can be inside piRNA loci or not). (I) The rare class; (J) the common class. The number of retrotransposon insertions in each category, the mean and standard error (SE) of S scores for each category appears below each boxplot. Kolmogorov-Smirnov tests were used to assess the statistical significance, and the P-values appear above the boxplots. In each boxplot, the minimum, 25%, 50%, and 75% quantiles, and the maximum S scores are represented by horizontal lines. The black dot is the mean S score. S scores greater than 500 are not plotted.

