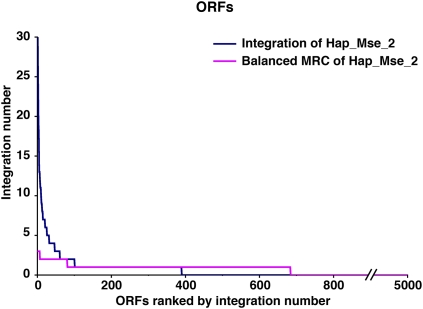
Figure 6.
All ORFs of S. pombe ranked by the number of insertions in the Hap_Mse_2 experiment. The ORFs were plotted on the x-axis in order of their number of insertions (blue). (Magenta) The distribution of the corresponding random control MRC Hap_Mse_2 increased in number to have the same number of insertions in ORFs as in the Hap_Mse_2 data.

