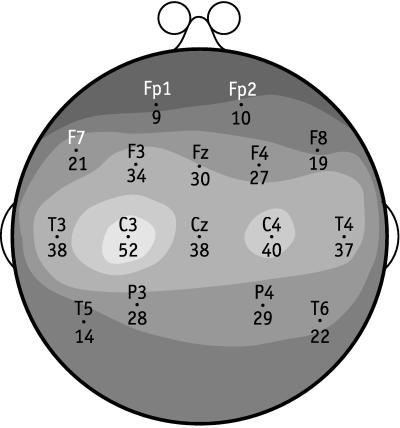
Figure 1.
Shaded contour map of recognition-rate surface for the 10–20 system of EEG sensors for subject S8. The physical surface of the scalp is represented as a plane circle as is standard in representations of the 10–20 system. The recognition rate for each sensor is shown, next to it, as the number of test samples of sentences correctly recognized of a total of 60. The predictions are for the best parameters L = 3 Hz, W = 7 Hz, s = 88 ms, and e = 2,455 ms.

