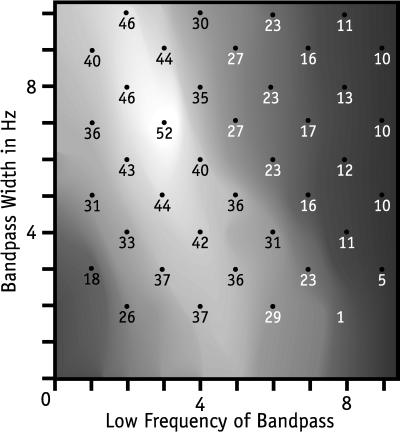
Figure 2.
Contour map of recognition-rate surface for filter parameters L and W for subject S8. The x coordinate is the low frequency (L) in Hz and the y coordinate is the width (W) in Hz of a filter. The number plotted as a point on the map is the number of test samples of sentences correctly recognized of a total of 60 by the Butterworth filter with the coordinates of the point. The predictions are for the best temporal parameters s = 88 ms, e = 2,455 ms, and best sensor C3.

