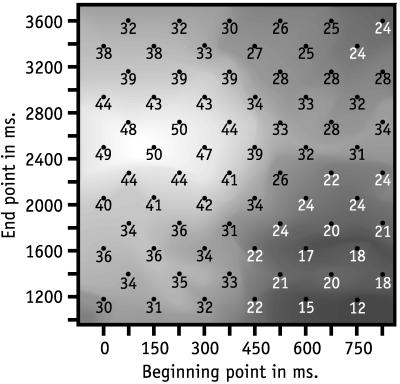
Figure 3.
Contour map of recognition-rate surface for start (s) and ending (e) parameters for subject S8. The x coordinate is the start point (s), measured in ms, of the interval of observations, used for prediction. The y coordinate is the ending point (e), measured in ms, of the same interval. The recognition-rate numbers have the same meaning as in Figs. 1 and 2. The predictions are for the best filter parameters L = 3 Hz and W = 7 Hz, and best sensor C3.

