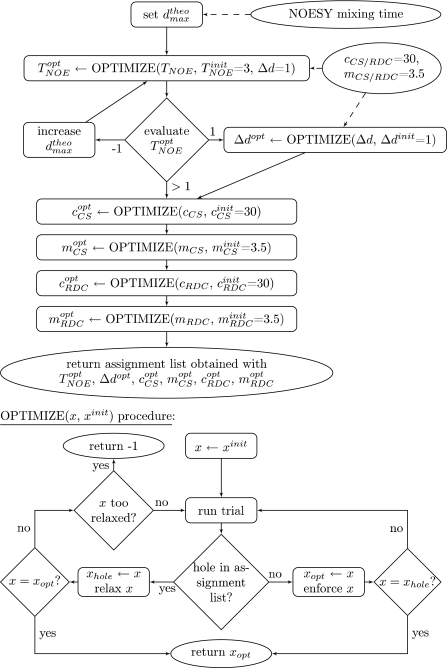
Fig. 2.
Flowchart of the parameter optimization protocol. First are optimized the NOE thresholds d theomax (maximum 1 H N–1 H N distance in 3D structure, one value for each NOE intensity class), T NOE (number of allowed outliers) and Δd (outlier range in Å). Then are optimized the CS thresholds c CS (decay constant of RMSD filter) and m CS (minimum RMSD threshold) and finally the RDC thresholds c RDC and m RDC. See text for further explanations

