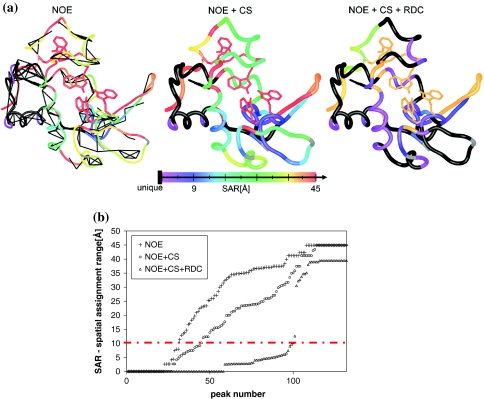
Fig. 3.
Assignment results on lysozyme using experimental data obtained by (Schwalbe et al. 2001). a Results represented on the NMR structure 1E8L (Schwalbe et al. 2001), using NOE data only (left, case 1 of Table 2), NOE + CS data (middle, case 2 of Table 2), NOE + CS + RDC data (right, case 3 of Table 2). The black lines on the left structure correspond to the experimental NOEs network. Proline residues are shown in gray. The color code represents the spatial assignment range (SAR), as depicted in the colorbar below the structures. Unique assignments are shown in black. b Spatial assignment range (SAR) for each peak and for each case. The peaks are ordered by increasing SAR values. The SAR-value of 10 Å that has been chosen as maximum for the class of exploitable peaks is depicted (dashed red line)

