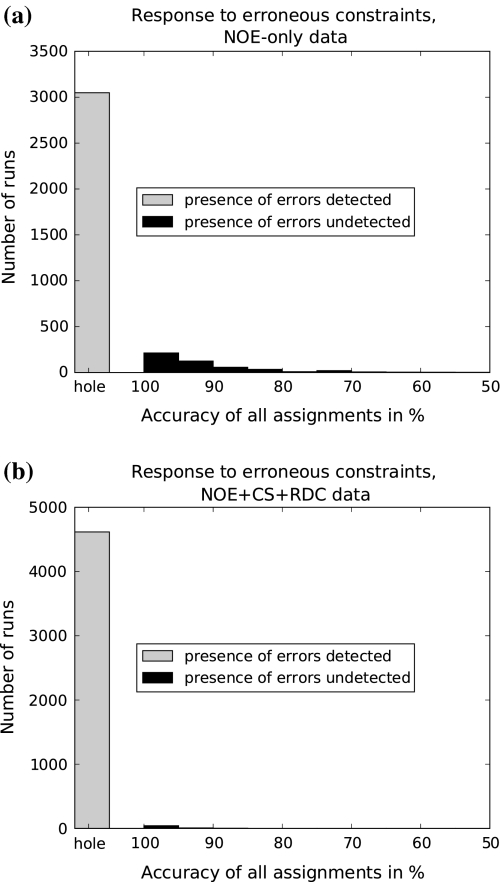
Fig. 5.
The response of NOEnet to erroneous constraints is shown on the corrupted NOE data set introduced in Fig. 4. All runs that were done for Fig. 4 are taken together, independent of the number of erroneous NOE-constraints, as their amount is not known in advance in real situations. The gray bar shows the number of runs for which the presence of erroneous NOE-constraints is detected successfully through the appearance of holes in the assignment ensemble. The black bars show the number of runs for which the detection is not successful, as no hole occurred. The distribution of assignment accuracies of these runs is shown in form of a histogram. a The NOE-only data set. b The NOE+CS+RDC data set

