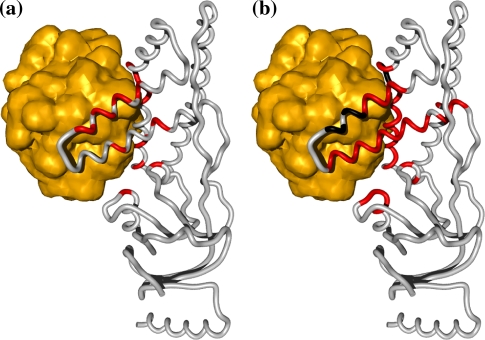
Fig. 7.
Interaction site estimation of EIN-Hpr using 15 N–1 H chemical shift perturbation (CSP) data (Garrett et al. 1997b) with a the correct assignment and b the assignment ensemble obtained by NOEnet (Case 4 of Table 3). The NMR structure of the complex EIN-Hpr (PDB 3EZA (Garrett et al. 1999)) is shown here. EIN is shown by its backbone ribbon and Hpr is shown in yellow by its solvent accessible surface (including side chains). a Using the correct assignment, the corresponding residues of the perturbated peaks are colored in red. b The ensemble of assignment possibilities of the same perturbed peaks are colored in red and in black. The unique assignments are colored in black, while the assignment possibilities of the perturbed peaks with a SAR value below 30 Å are colored in red

