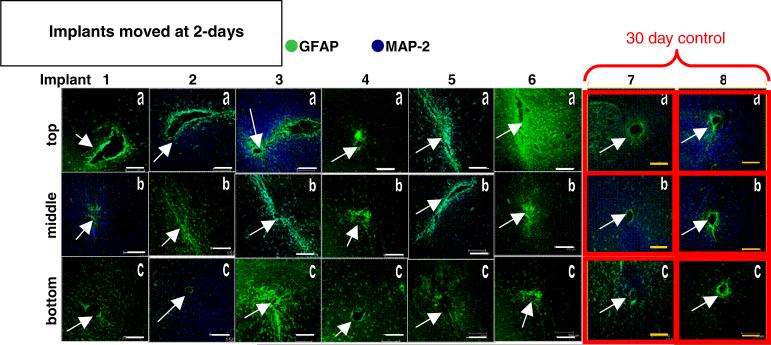
Figure 3.
Immunohistological images from the implant site for the movement at day-2 cohort (columns 1–6) and the 30-day control (columns 7–8). Each column is a separate implant; each row is the top (a), middle (b), or bottom (c) sections of the implant site. Scale bars are 150 μm. Arrows indicate implant sites.

