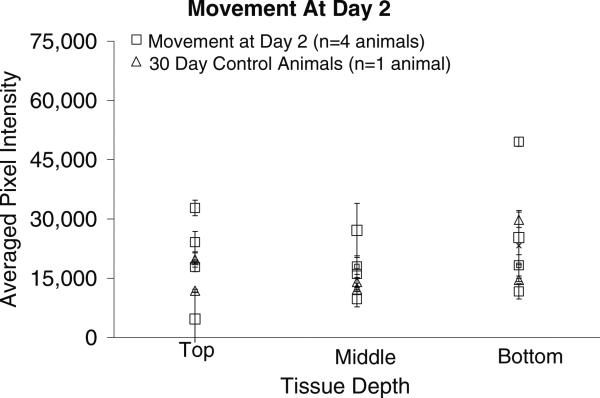
Figure 4.
Graphical representation of GFAP pixel intensities (mean ± std dev over two or three brain sections at each depth) around the implant site for the movement at day-2 cohort and 30-day control animals. The pixel intensities are directly related to the level of GFAP expression in the tissue, with higher pixel intensities indicating higher levels of GFAP and a more significant glial scar. There is statistically no difference between the 30-day control tissue samples and the movement at day-2 tissue samples at the top, middle or bottom of the implant.

