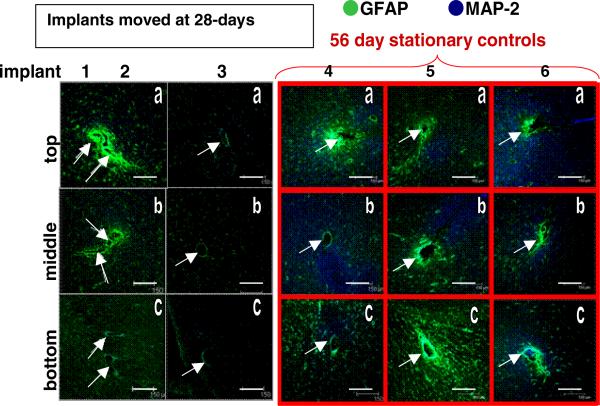
Figure 7.
Immunohistological images from the implant site for the movement at day-28 cohort (columns 1–3) and the 56-day control (columns 4–6). Each column is one separate implant; each row is the top (a), middle (b) or bottom (c) sections of the implant site. Scale bars are 150 μm. Arrows indicate implant sites (two separate implant sites in each tissue section of the first column).

