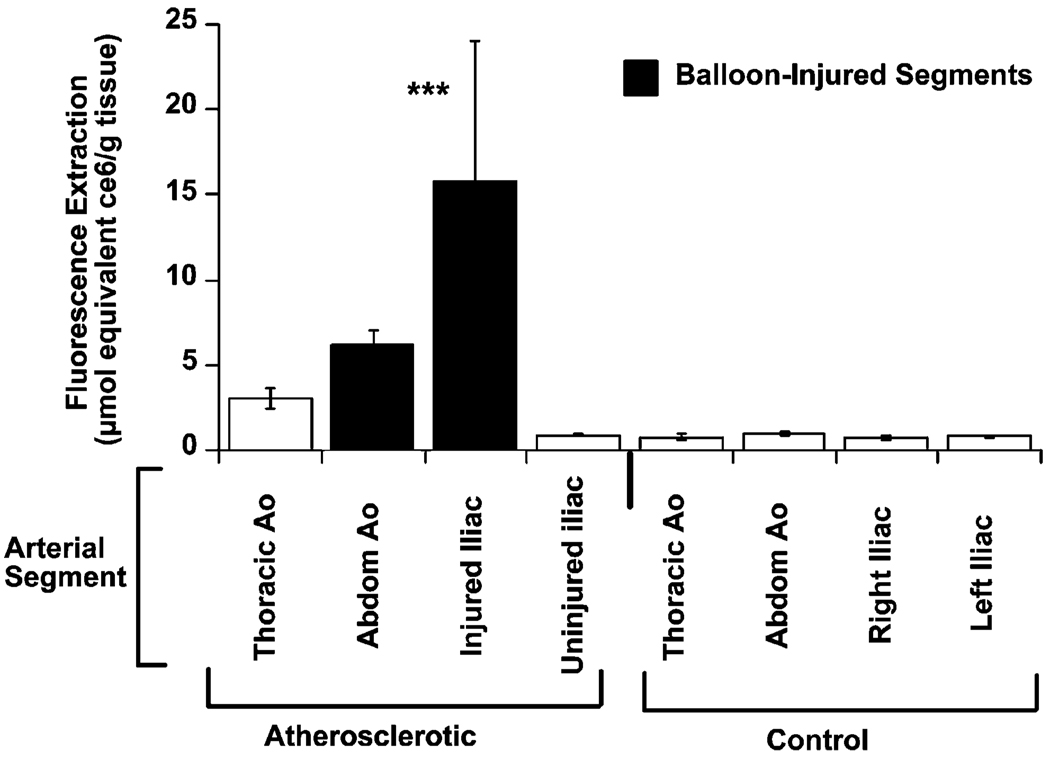
Fig. 3.
Fluorescence quantification by extraction from atherosclerotic and control aortae demonstrates the tissue concentration of MA-ce6 (in nmol ce6 equiv (g tissue)−1) for arterial segments taken from atherosclerotic and control animals. The tissue concentration of MA-ce6 was significantly increased in all sections from atherosclerotic rabbits compared to the corresponding sections of aorta from control rabbits injected with conjugate (p < 0.001 ANOVA atherosclerotic animals vs. controls).

