
Fig. 4.
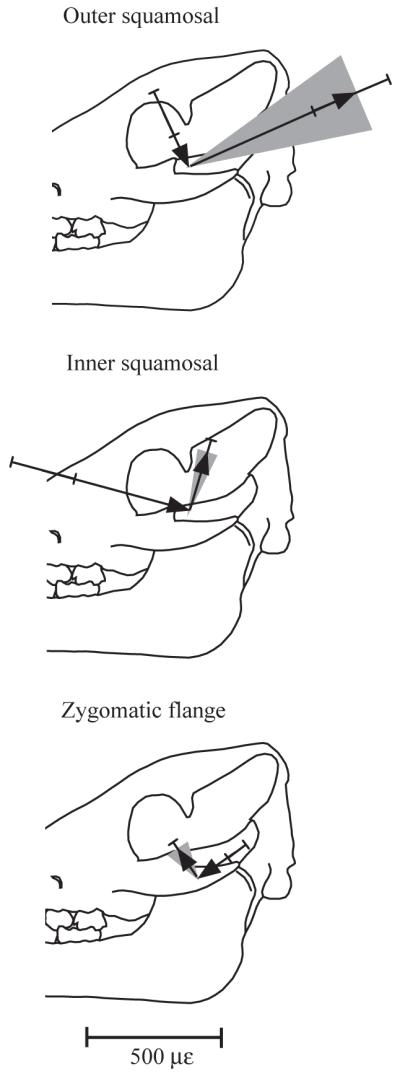
Summary of the peak principal strains and their orientations at the three gauge locations. The length of the arrow indicates the magnitude of the mean peak principal strain, and the error bars indicate one standard deviation. The mean orientation is represented by the direction of the arrow, and the shaded area around the tensile principal strain indicates the standard deviation of strain orientation.