
Fig. 5.
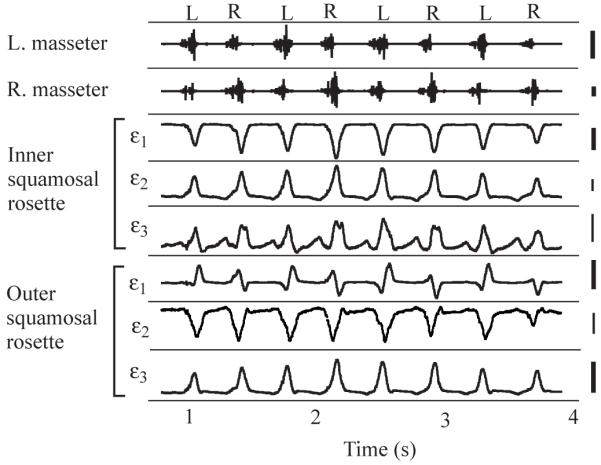
Example of typical electromyogram (EMG) (top two traces) and rosette strain (bottom six traces) recordings. ε1, ε2 and ε3 are the three elements of each rosette gauge. L and R at the top of the figure indicate chewing side (left or right). Thick scale bars, 0.5 V for EMG and 500 με for strain. Thin bars, 100 με. Data are from pig 236.