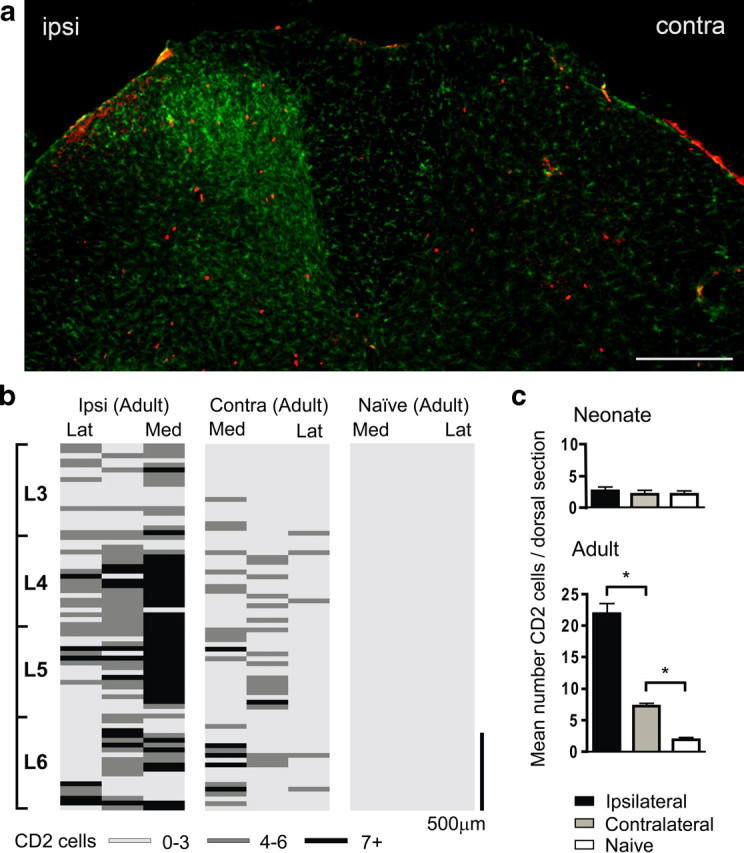
Figure 4.

a, Lumbar dorsal horn of the rat spinal cord 7 d after SNI labeled with the microglial marker Iba1 (green) and the T-cell marker CD2 (red). Both immune cells types are predominantly present in the ipsilateral (ipsi) dorsal horn. Contra denotes contralateral. Scale bar, 250 μm. b, Distribution of T-lymphocytes in the dorsal horn of the spinal cord. Location of CD2 cells is shown as an intensity map with darker shading representing greater number of profiles per region counted. The dorsal quadrant of each 30 μm section was split into three sections: medial (Med), middle, and lateral (Lat) cord; binned cell counts were represented by a shaded bars (light gray, 0–3 cells; dark gray, 4–6 cells; black, 7 or greater), and bars were stacked relative to their position within the lumbar cord. The T-cell distribution is shown for adult ipsilateral (ipsi) and contralateral (contra) 7 d SNI and naive cord. Scale bar, 500 μm. c, Mean number ± SEM of CD2-immunoreactive cells per dorsal horn section within the L3–L6 region, in adult and neonatal ipsilateral, contralateral, and naive rats. *p < 0.05, one-way ANOVA, Bonferroni's multiple comparison, n = 3 animals per group.
