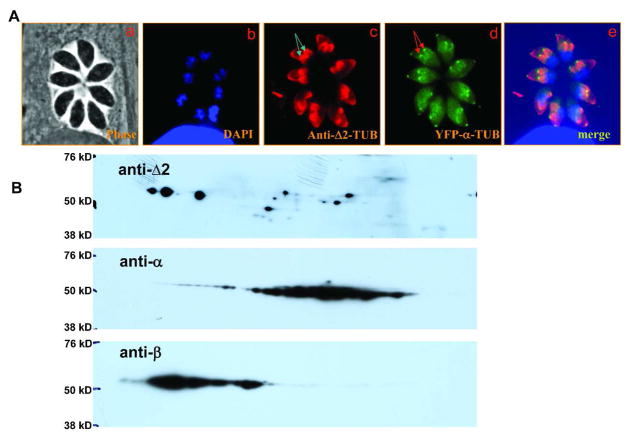
Figure 3. Analysis of Δ2-tubulin posttranslational modification of cytoskeletal tubulins using immunofluorescence microscopy and immunoblot.
A. Phase contrast image (a) corresponding to images b through e; immunofluorescence analysis of cells imaged with DAPI for DNA (b), anti-Δ2-tubulin (c), YFP-α-tubulin (d), and the merged image c and d (e). Note the bright staining of anti-Δ2-tubulin around the conoid region of daughter cells (arrows).
B. Immunoblot analysis using anti-Δ2-, anti-α-, and anti-β-tubulin. This demonstrates labelling of both α and β tubulin by anti-Δ2-tubulin. The same immunoblot was used for each antibody. The immunoblot was stripped between antibody incubations using a standard protocol.

