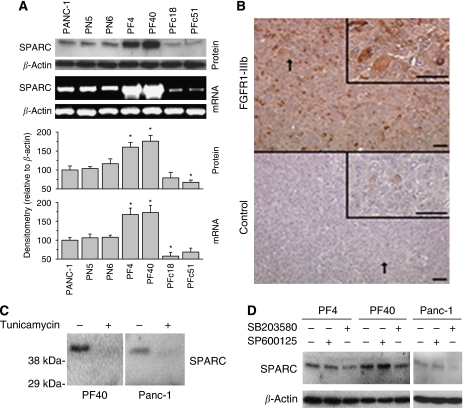
Figure 5.
Function of FGFR1-III isoform expression and p38-MAPK activity for SPARC expression. (A) SPARC expression in cells over-expressing FGFR1-IIIb and FGFR1-IIIc. The upper panels show representative SPARC immunoblot and PCR analyses in wild-type PANC-1 cells, PN5 and PN6 control-transfected, FGFR1-IIIb over-expressing PF4 and PF40, and FGFR1-IIIc over-expressing PFc18 and PFc51 cells. Densitometry of bands in relation to respective β-actin of three separate experiments is shown in the lower panel. The results are mean expression levels (±s.d.) in relation to wild-type PANC-1 (100%) of three separate experiments. *P<0.05 compared with wild-type and control-transfected cells. (B) SPARC expression in xenograft tumours. Immunohistochemical analysis of SPARC was performed in FGFR1-IIIb over-expressing (upper panel) and control-transfected (lower panel) tumours (Liu et al, 2007b). Representative areas from proliferating areas are shown. The arrow depicts the area of magnification of the inset. Bar=50 μm. (C) Glycosylation of SPARC. Incubation of FGFR1-IIIb over-expressing PF4 and wild-type PANC-1 cells with tunicamycin showed that SPARC protein was glycosylated. (D) Effects of the p38-MAPK inhibitor SB203580 and the JNK inhibitor SP600125 on endogenous SPARC expression in FGFR1-IIIb over-expressing PF4 and PF40 and wild-type PANC-1 cells. Indicated cells were incubated in the absence (−) and presence (+) of SB203580 (20 μM) or SP600125 (2 μM) for 24 h before analysis.

