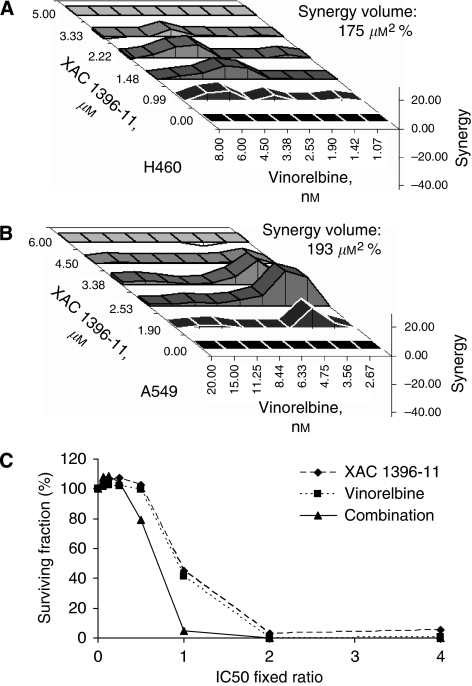
Figure 3.
XAC 1396-11 synergises with cytotoxic anticancer drugs in H460 and A549 cell lines. (A) H460 (A) and A549 (B) cells were treated in a five by eight checkerboard matrix of XAC 1396-11/cytotoxic combinations, plus each drug tested alone, covering the concentration–effect curve. After 72 h, plates were fixed and analysed by SRB before determining synergy using the three-dimensional Pritchard and Shipman model. Positive values (above the baseline) represent synergy; negative values (below the surface) are antagonistic. The overall synergy value (μM2%) is shown at the 95% confidence interval. (C) H460 cells were treated as in Table 1. The x axis shows the fixed ratio used in the combination with equipotent concentrations of the single agents. The combination arm shifts the concentration–effect curve to the left. All experiments were repeated in triplicate, error bars show s.e.m.

