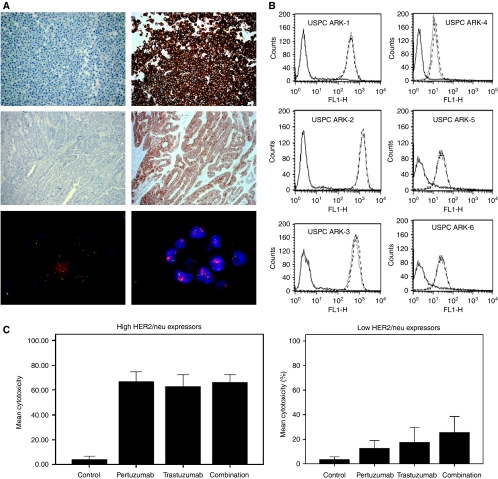
Figure 1.
(A) Upper panel: Representative HER2/neu expression by immunohistochemistry (IHC) in uterine serous papillary adenocarcinoma (USPC) cell blocks. Left: USPC ARK-4 shows negative staining for HER2/neu; Right: USPC ARK-3 shows strong (3+) staining for HER2/neu. Middle panel: Representative HER2/neu expression by IHC in USPC tissue blocks. Left: USPC ARK-6 shows low/negative staining for HER2/neu; Right: USPC ARK-2 shows strong (3+) staining for HER2/neu. Lower panel: Representative example of negative (USPC ARK-6, left) vs positive (USPC-ARK2, right) fluorescent in situ hybridisation (FISH) amplification of the c-erbb2 gene. Tumour cells were scored for the number of red (HER2/neu) and green (chromosome 17) signals as described in the Methods section. (B) Flow cytometry histograms of primary USPC cell lines showing high (USPC ARK-1, USPC ARK-2, and USPC ARK-3) and low (USPC ARK-4, USPC ARK-5, and USPC ARK-6) expression of HER2/neu. Rituximab-anti-CD20 control antibody (solid line); trastuzumab (dashed line); pertuzumab (dotted line). (C) Left panel: Antibody-dependent cytotoxicity (mean±s.d.) in USPC cell lines with high HER2/neu expression (i.e., USPC ARK-1, -2, and -3). Average percentage cytotoxicity in high expressors from six independent matched experiments, showing significantly higher cytotoxicity with trastuzumab (the Kruskall–Wallis test and χ2 analysis, P=0.001), pertuzumab (P=0.0001), and combination of pertuzumab and trastuzumab (P=0.001) when compared with either peripheral blood lymphocytes (PBLs) only or control antibody rituximab. E : T, effector to target cell ratio. Right panel: Antibody-dependent cytotoxicity (mean±s.d.) in USPC cell lines with a low HER2/neu expression (i.e., USPC ARK-4, -5, and -6). Average percentage cytotoxicity in low expressors from 12 independent experiments, showing significantly higher cytotoxicity with trastuzumab (P<0.01), pertuzumab (P=0.01), and combination of pertuzumab and trastuzumab (P=0.01) when compared with either PBLs only or control antibody rituximab. Combination of pertuzumab and trastuzumab (total dose 2.5 μg ml−1) induced significantly higher cytotoxicity (P=0.001) when compared with either trastuzumab (2.5 μg ml−1) or pertuzumab (2.5 μg ml−1) alone. E : T, effector to target cell ratio.

