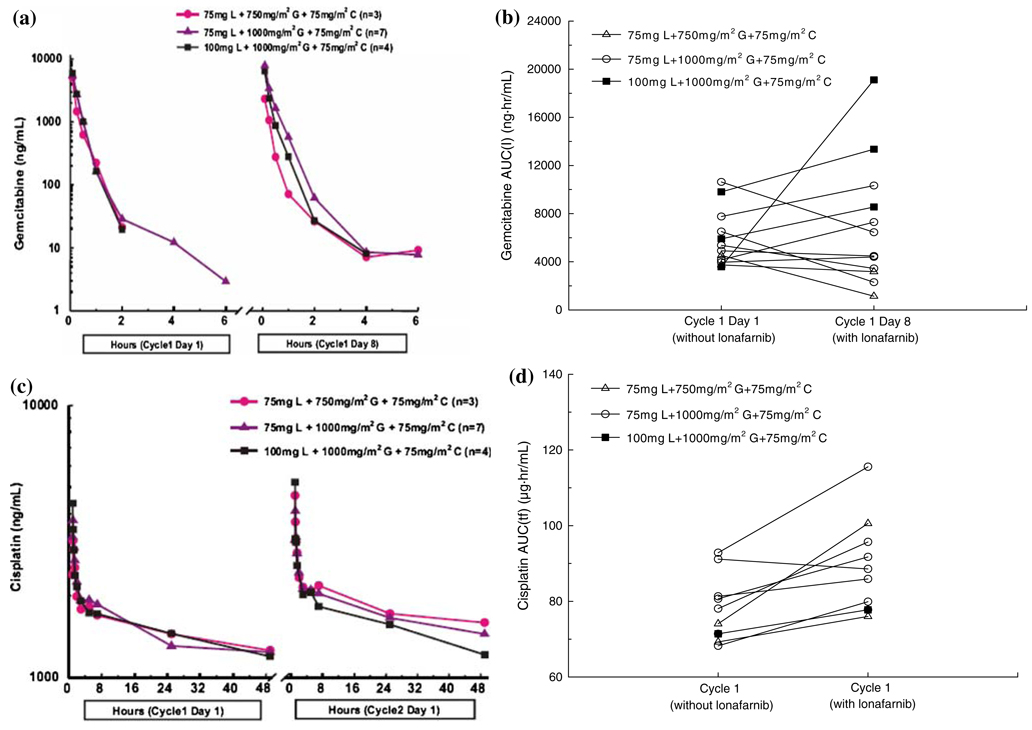
Fig. 3.
a Mean gemcitabine plasma concentrations versus time profiles following weekly 30 min intravenous infusion of gemcitabine without (day 1) and with (day 8) oral administration of lonafarnib and cisplatin. b Individual gemcitabine area under the curve (AUC) values following weekly 30 min intravenous infusion of gemcitabine without (day 1) and with (day 8) oral administration of lonafarnib and intravenous cisplatin. c Mean Plasma cisplatin concentrations of versus time profiles following day 1 60 min intravenous infusion of cisplatin in every cycle without (cycle 1) and with (cycle 2) administration of lonafarnib and gemcitabine. d Individual cisplatin area under the curve (AUC) values following day 1 60 min intravenous infusion of cisplatin in every cycle without (cycle 1) and with (cycle 2) administration of lonafarnib and gemcitabine

