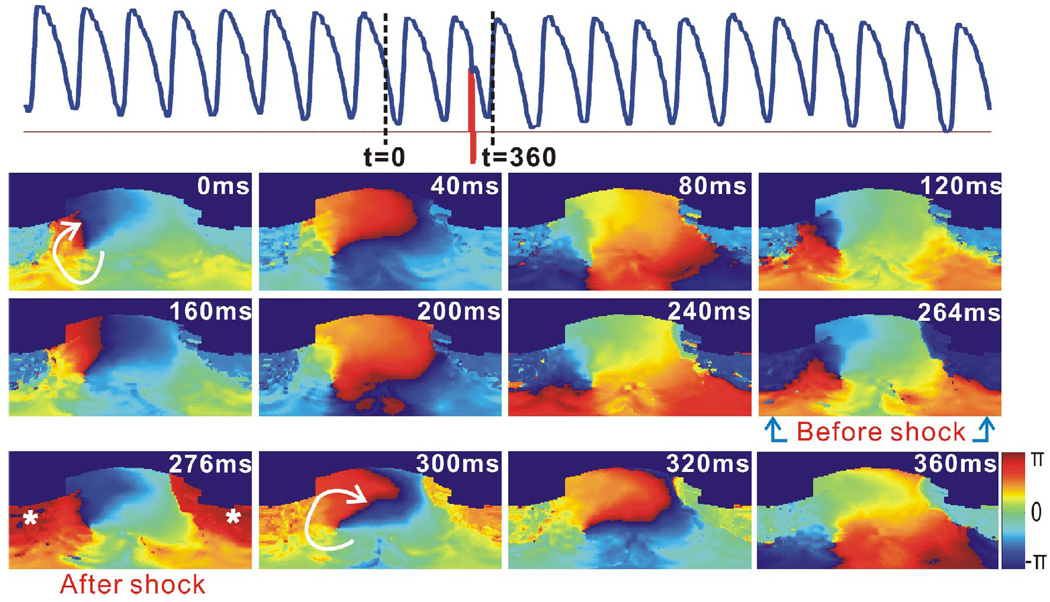
Figure 4.
Failure of cardioversion due to the improper application time of 1BP. This VT had the same morphology as that in Figure 3. Top: Optical action potential (blue) shows the cardioversion failure of a 1BP (red, 4 V/cm, t=266 ms). Lower panels are 2D wrapped phase maps.

