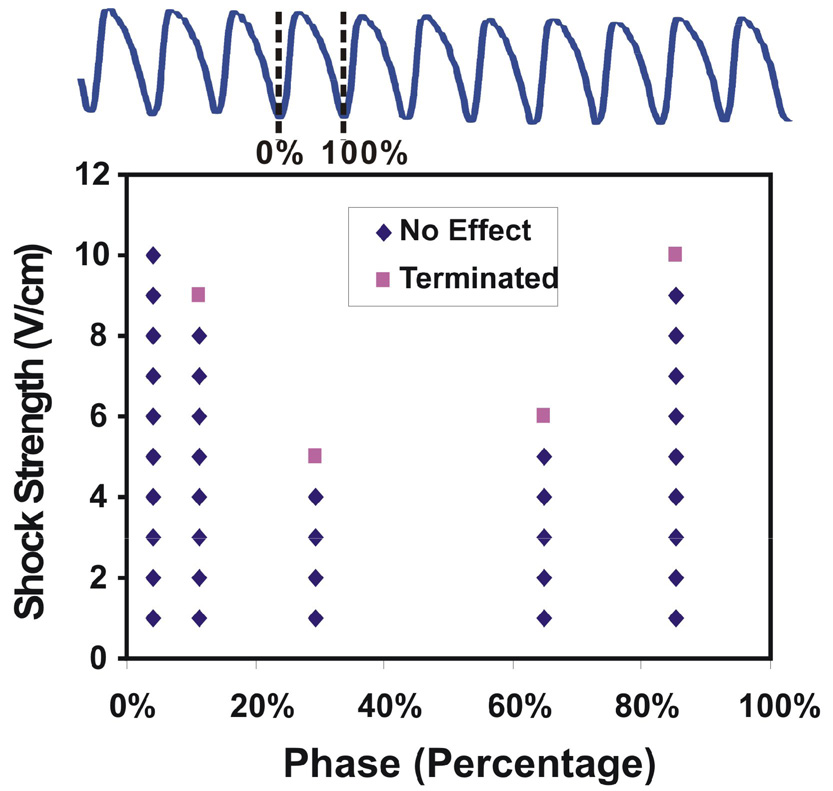
Figure 6.
Plot of the application phases of the shock versus CVTs with 1BP for the VTs with a same morphology. The application phase varied within one VT CL. Shock strength started with 1 V/cm and was increased by 1 V/cm until VT was terminated or the shock strength reached the maximum amplitude we could deliver (10 V/cm). The CVT varied greatly as a function of the application phase.

