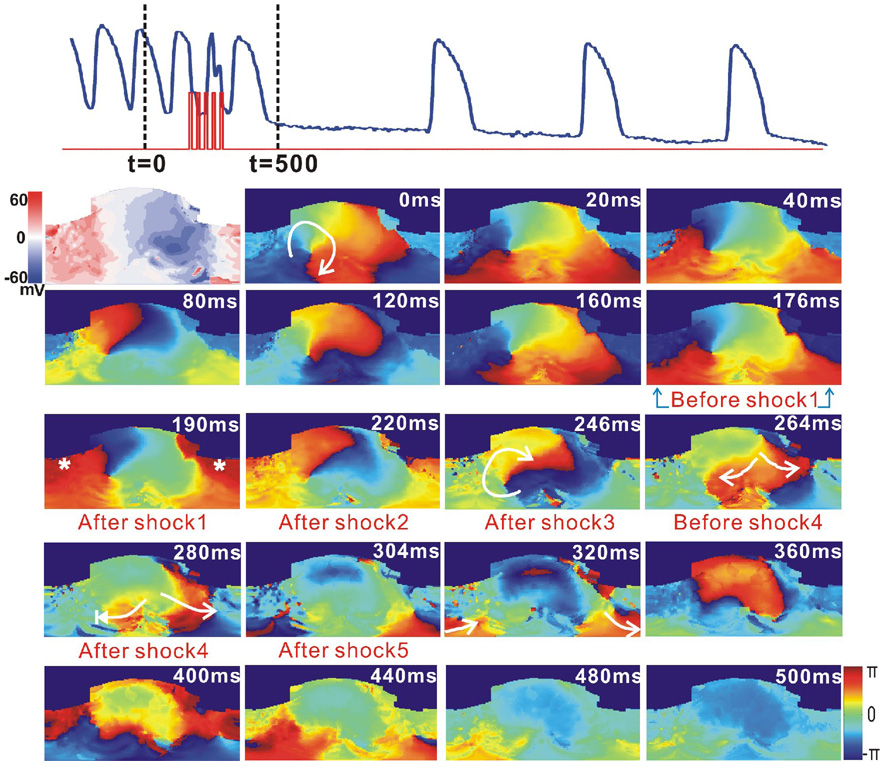
Figure 7.
Termination of VT by 5MP applied within one VT CL. Top: Optical action potential (blue) shows that VT unpinned and self-terminated after application of 5MP (red, 4 V/cm, t=177 ms). The first panel below the optical trace is a VEP map measured from a 1MP shock (5V/cm) applied at the plateau-phase. The other panels are 2D unwrapped phase maps.

