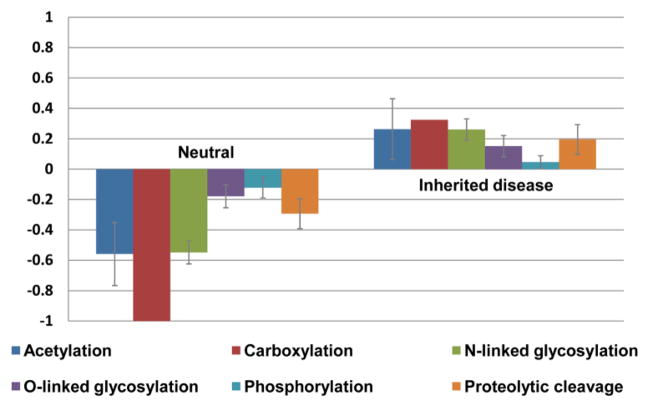
Figure 3.
Trends that indicate whether a data set is enriched (T > 0) or depleted (T < 0) in direct matches between amino acid substitutions and true post-translational modifications. Only modifications with 5 matches or more are shown. The error bars indicate 68% confidence intervals estimated by bootstrapping with 10,000 iterations.

