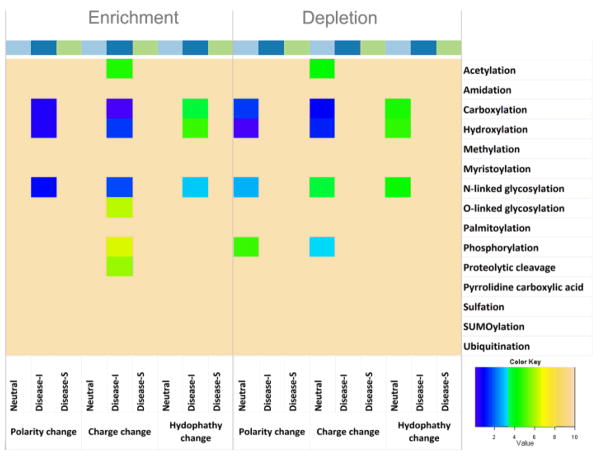
Figure 7.
Enrichment and depletion of types of amino acid substitutions observed in the sets of disease-associated substitutions and putatively neutral polymorphisms. P-values were calculated using the binomial distribution. The plotted value is 10+ log10(P + 1·10−10), where P is the P-value. The darker colors indicate values with lower P-values. All values below the Bonferroni-corrected value 3.7e-4 were set to 1.

