Fig. 7.
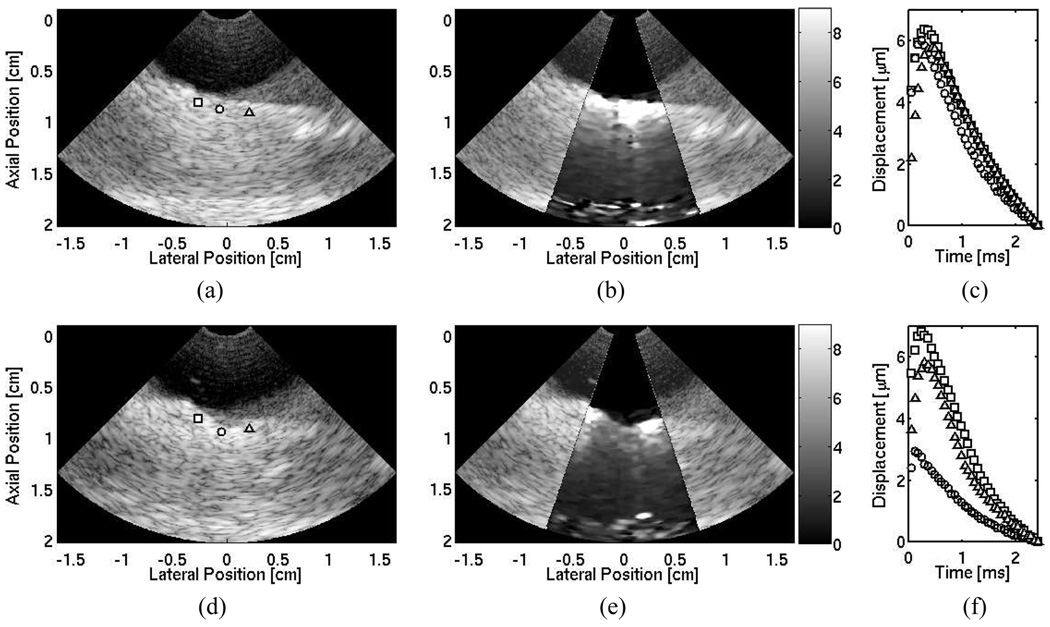
Matched B-mode (a) and ARFI (b) images of nonablated ovine right ventricular myocardium located between axial depths of 0.5 cm to 1.7 cm, and resting on a degassed sponge below. A water/saline mixture is between the transducer and the tissue. Three shapes (square, circle, and diamond) indicate points of interest on the surface of the tissue. The circle marks the ablation site. The corresponding ARFI image (µm away from the transducer) is superimposed on the B-mode image of the healthy, nonablated cardiac tissue. (c) Displacement profiles at three points within the tissue that show local stiffnesses along the surface of the tissue. After a single radiofrequency ablation, (d) the B-mode image indicates a small crater at the ablation site. (e) The matched ARFI image superimposed on the B-mode image displays a region around the crater that displaces (µm away from the transducer) less. (f) Updated displacement profiles also reflect this decrease in displacement at the lesion site.

