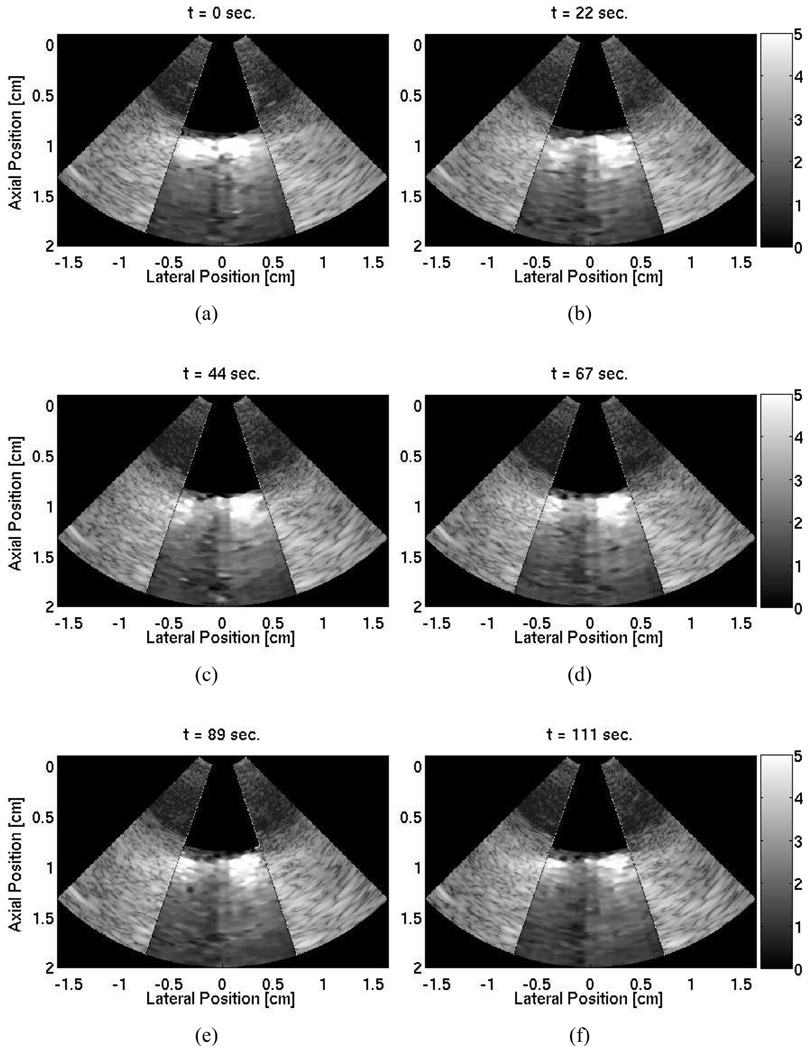
Fig. 8.
Time lapse ARFI images superimposed on their corresponding B-mode images of a 120 second cardiac ablation. A 1.0 cm bath of water/saline mixture is between the transducer and the cardiac tissue. The tissue is located between axial depths of 1.0 cm and 1.7 cm resting on a degassed sponge below. The ablation site is laterally centered on the surface of the tissue at a depth of 1.0 cm. The images show the ablation progress at times: (a) 0 s, (b) 22 s, (c) 44 s, (d) 67 s, (e) 89 s, and (d) 111 s. A developing stiffer region that displaces (µm away from the transducer) less than the surrounding tissue can be observed.

