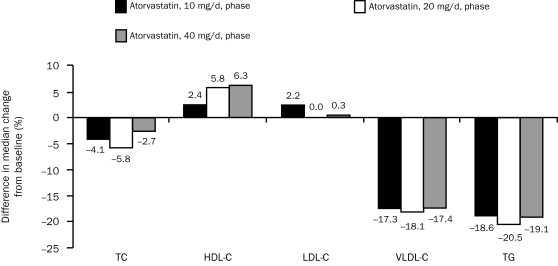
FIGURE 3.
Difference in median change from baseline in lipoprotein lipid parameters between prescription omega-3-acid ethyl esters (P-OM3) and placebo, when given in combination with atorvastatin, 10, 20, and 40 mg/d. P values are calculated for the difference in the median percentage change from baseline between P-OM3 and placebo. P values were <.001 for total cholesterol (TC); <.001 for high-density lipoprotein cholesterol (HDL-C); 0.24, 0.86, and 0.64 for low-density lipoprotein cholesterol (LDL-C) during the 10-mg, 20-mg, and 40-mg phases, respectively; and <.001 for very low-density lipoprotein cholesterol (VLDL-C) and triglycerides (TG).

