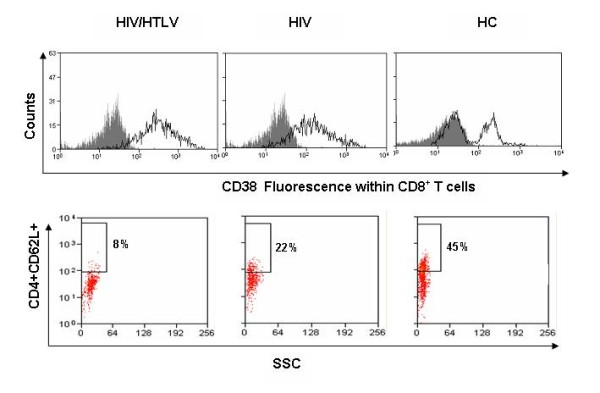
Figure 3.

Activated and naïve T cell profiles HIV/HTLV-1 co-infected, HIV mono-infected and healthy Mozambican subjects. Dot plots show the typical phenotype of activated (upper panels) and naïve T lymphocytes (lower panel). Upper panels reveal that co-infected patients presented with higher density of CD38 molecules on T CD8+ T cells. Co-infected patients presented lower frequency of CD4+CD62L+ cells when compared with HIV positive patients and health controls (lower panel).
