
Figure 5. OleD active site structure.
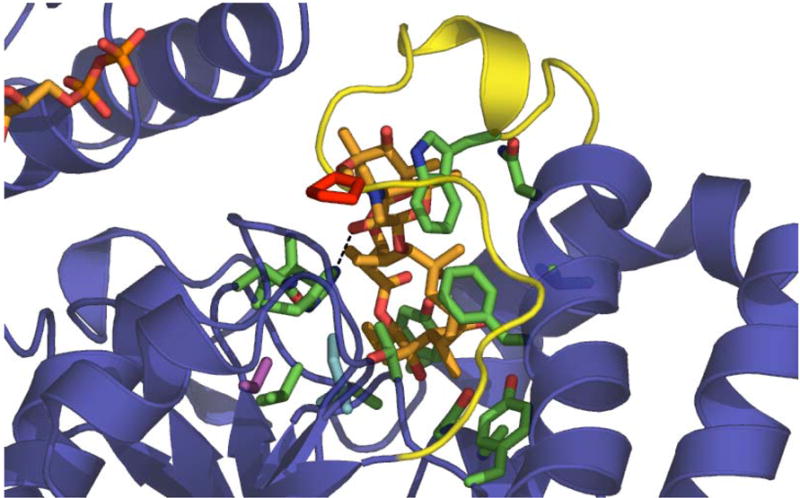
The key residues delineated in this study are highlighted within the previously reported active site structure of OleD bound to oleandomycin and NDP (PDB file 21YF). Color designations – substrates, orange; Pro-67, red; Ile-112, cyan; Ser-132, magenta; loop N3, yellow; dashed line, H-bond between the catalytic His-25 and acceptor sugar-OH. Residues in green are those that form the acceptor binding pocket, which is largely hydrophobic.