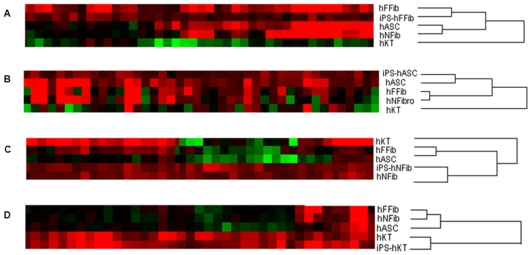
Figure 5. Hierarchical clustering of upregulated genes in the hiPSC and donor cells.
(A) iPS-hFFib and hFFib. (B) iPS-hASC and hASC. (C) iPS-hNFib and hNFib. (D) iPS-hKT and hKT. Hierarchical clustering of the upregulated gene expression data shows that hiPSCs cluster more closely to their corresponding donor cells. This demonstrates that reprogrammed hiPSCs exhibit persistent gene expression from their corresponding donor cells.

