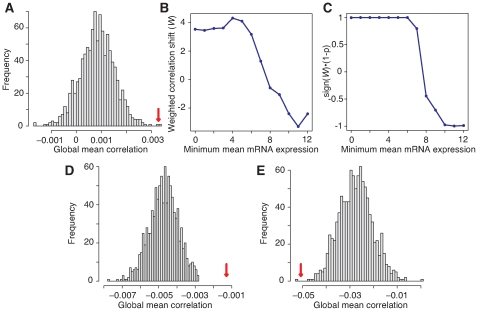
Figure 1. Permutation of miRNA-mRNA target relationships reveals a positive correlation between miRNAs and their targets, or negative for some high-prevalence mRNAs.
(A) Histogram of permuted values of mean correlation between levels of miRNAs and those of their target mRNAs. Red arrowhead indicates true value. (2-sided p-value: 0.002) (B), (C) Weighted correlation shift ( ) and
) and  for a range of cutoffs of log (base 2) mRNA mean expression. (D), (E) Histogram of permuted values for mRNA log-expression cutoffs 4 and 11. (All plots were generated using a ddG cutoff of
  kcal/mol.)

