
Fig. 3.
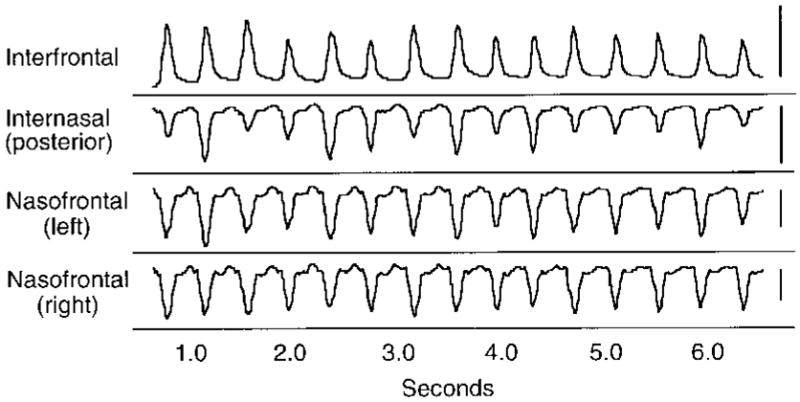
Sus scrofa. An example of typical strain recordings from sutures. Each peak corresponds to a masticatory cycle. The scale bar on the right is equivalent to one volt or 1,000 microstrain. Note that the interfrontal suture is in tension, whereas the other sutures are in compression. Data from pig 252.