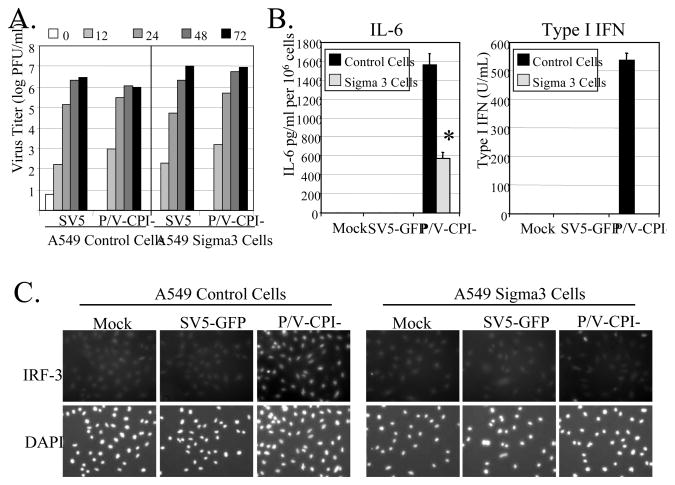
Figure 2. Role of dsRNA in cytokine induction by P/V-CPI-.
A) Virus growth. Control or Sigma3-expressing A549 cells were infected at an moi of 0.05 with WT SV5-GFP or P/V-CPI- and virus titers were determined at the indicated times post infection. Results are representative of two independent experiments. B) Cytokine induction. Control or sigma3-expressing A549 cells were infected at an moi of 10 with SV5-GFP or P/V-CPI-. At 24 h pi, media was analyzed for levels of IL-6 by ELISA (left panel) or Type I IFN by bioassay (right panel). Results are expressed as mean values from triplicate samples with error bars representing standard deviation. For IL-6, values are normalized to 106 cells. *, p value less than 0.004 compared to corresponding control cells. C) IRF3 nuclear translocation. Control or sigma3 A549 cells were infected at an moi of 10 with the indicated viruses. At 24 h pi, cells were stained with DAPI and with antibodies specific for IRF-3.

