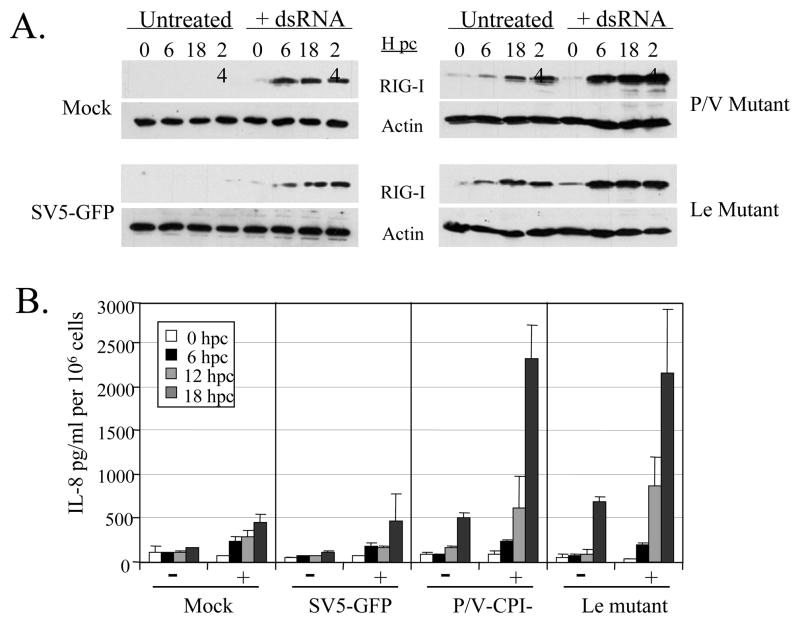
Figure 5. Kinetics of RIG-I induction and cytokine secretion following infection and treatment with dsRNA.
293-TLR3 cells were mock infected or infected at an moi of 10 with the indicated viruses. At 6 h pi, cells were left untreated or treated with (+) 5 ug/ml PolyI:C dsRNA. At the indicated times post challenge with dsRNA, cell lysates were analyzed for levels of RIG-I and actin (panel A) or media was analyzed for levels of IL-8 by ELISA (panel B). For panel B, data are from triplicate samples and error bars represent standard deviation from the mean.

