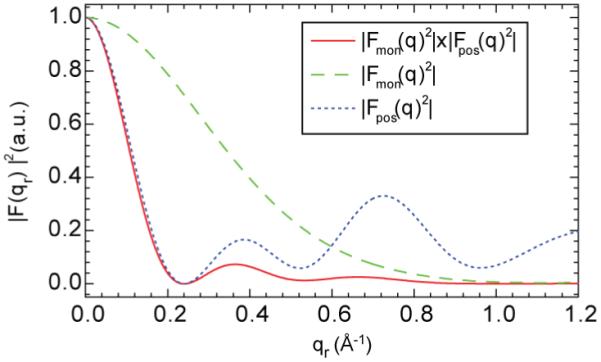
Figure 11.

The overall form factor of a barrel-stave bundle with number of peptide per bundle N=6 is shown by the solid red curve. The monotonically decreasing dashed green curve is the form factor for the monomer and the dotted blue curve with a local maximum near qr ≈0.7 Å-1 is the positional factor.
